Deployments

Running today.

Two live deployments in Tanzania, one for each product. FootprintTech operates in Tanzania, Uganda, Zambia and Qatar. Photographs and records on this page come from the deployments themselves.

26%

Live · AgriFarm™ deployment

Average yield improvement across the seven trial plots.

Managed plots compared with the farmers’ own plots, 2025/26 season. This is a trial result. The wider programme covers about 1,000 ha and is reported separately.

AgriFarm™ deployment.

Location context: FootprintTech operates in Tanzania, Uganda, Zambia and Qatar.

Deployed in Tanzania

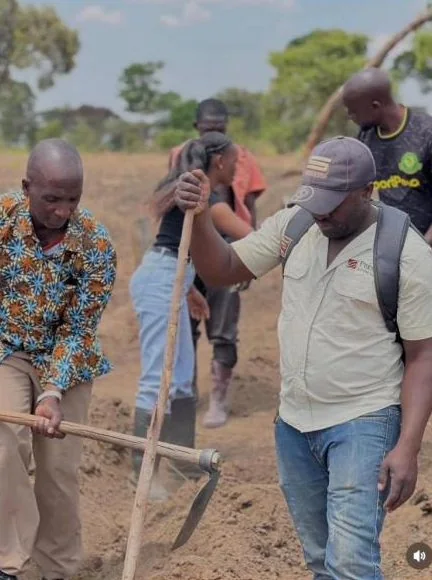
Field team digging and preparing a trial plot.
Trial photograph
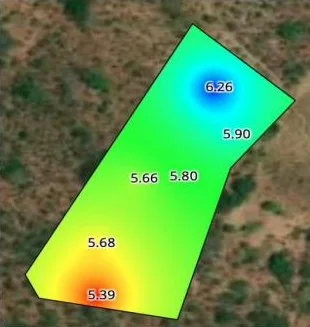
Soil pH record · one plot
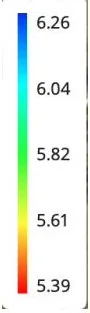
pH colour scale from low to high.Soil pH map of a trial plot, with sampling points labelled.
Produced by the sampling in the photograph
The problem
One input recipe applied to every plot, with no evidence of soil condition.
What we supplied and managed
Plot boundaries from satellite imagery, soil sampling at fixed points with laboratory testing, and a treatment plan for each plot.
What the customer sees
A record for every plot: soil results, the treatment applied and the comparison against the farmers’ own plots.
Result
26% average yield improvement across the seven trial plots. The programme area of about 1,000 ha is separate from the trial.
  1. 01MapPlot boundaries from satellite imagery.
  2. 02SampleSoil at fixed points, laboratory tested.
  3. 03TreatA lime and fertiliser plan per plot.
  4. 04CompareAgainst the farmers’ own plots.

Asset Control™ deployment.

Location context: FootprintTech operates in Tanzania, Uganda, Zambia and Qatar.

Deployed in Tanzania

Access controlCamera coverageOne recordWho enters and leavesMovement at the nodeWho, what, when
The problem
People and goods moving through a warehouse node without a reliable record of who entered, what moved and when.
What we supplied
Access control and camera coverage at a gated warehouse node, feeding one operational record.
Operating scope
Technology supplied to the operator, who runs the node.
What the customer sees
Who entered, what moved and when, checked against the record.
Scale
3,088 t a year moves through the node. This describes the scale of the operation. It is not an improvement figure.

Partners.